Documentation
Cabin Air Compressor Test
ReliablePlane™: CAC Health Test
- Version: ReliablePlane™ 2.02 (b.53)
- Author: SensOS, LLC
- Created: 18 May, 2024
- Updated: 14 Jul, 2024
If you have any questions that are beyond the scope of this document, Please feel free to email via info@sens-os.com
Description
The CAC Health Check is designed to collect the vibration, electrical and thermal data from the Air Cabin Compressor unit. The Technician can select a specific Aircraft Model, Tail/ID, System and Component to perform the Test. The data can be uploaded to the ReliablePlane™ cloud or the user can generate an instant pdf report on site.
Compatibility
This module is compatible with the following sensors:
- SensorWorks BluVib P-V-T
- FLIR ONE® Edge (Wireless Streaming)
- TPI 287 (Clamp-on Meter)
1-Channel / Wireless BLE Piezo-Sensor
Fmax: Up to 10,000 Hz
Spectral Lines of Resolution: Up to 12,800
Test Procedure
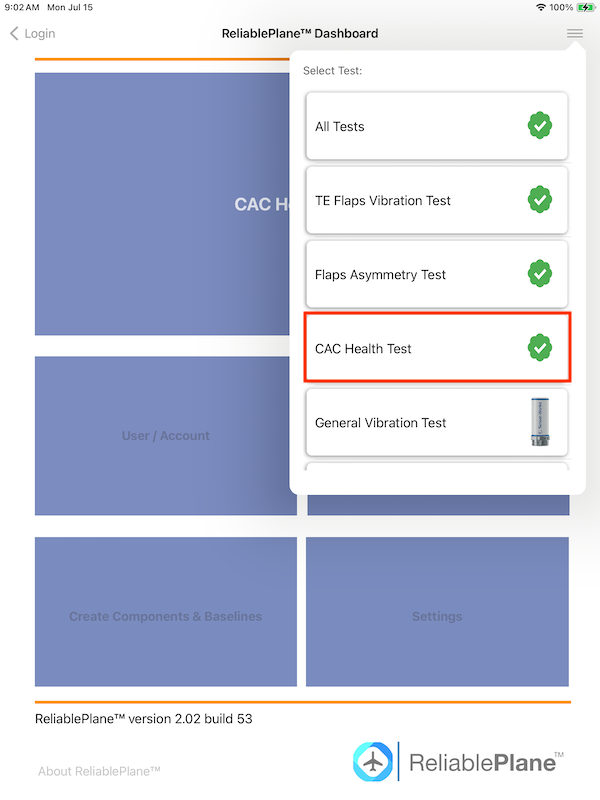
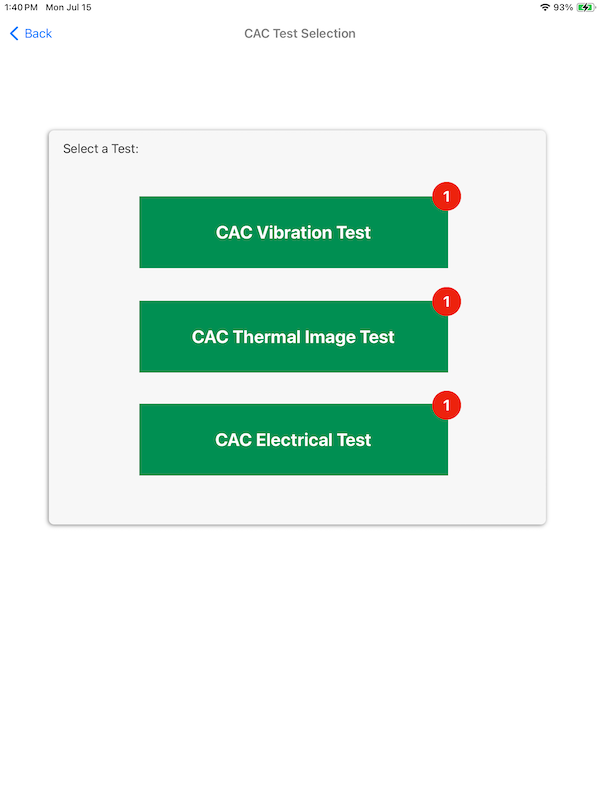
- Open the ReliablePlane™ App and select CAC Vibration Test from the the type of test from the top menu button. Close the pop-up view by clicking on the background outside of the box.
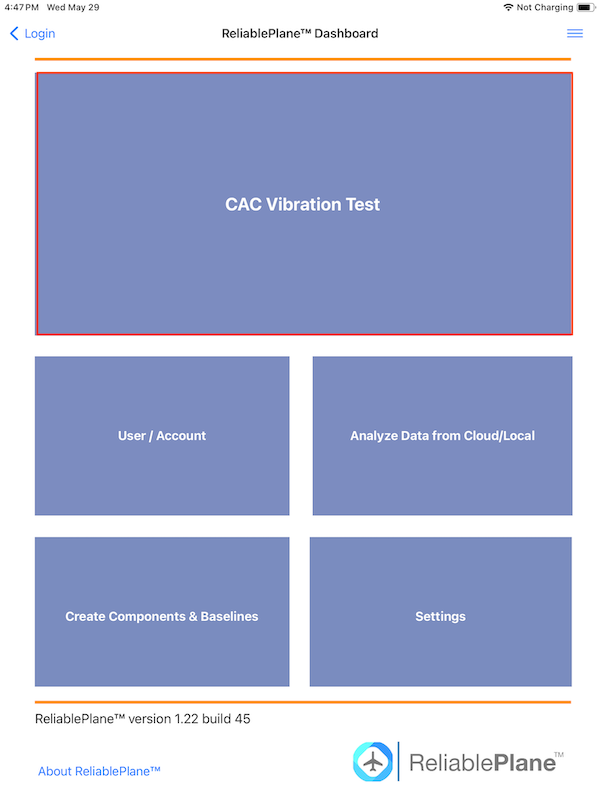
- Press the CAC Vibration Test button from the main dashboard
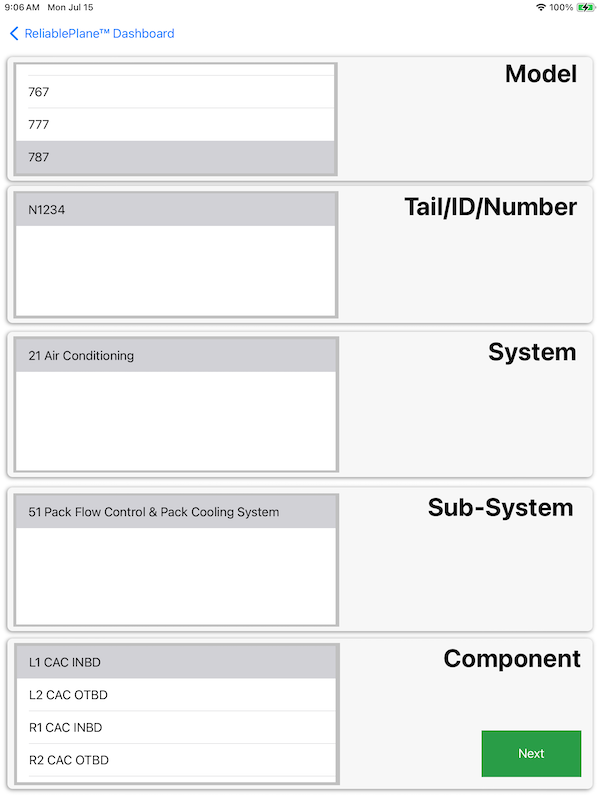
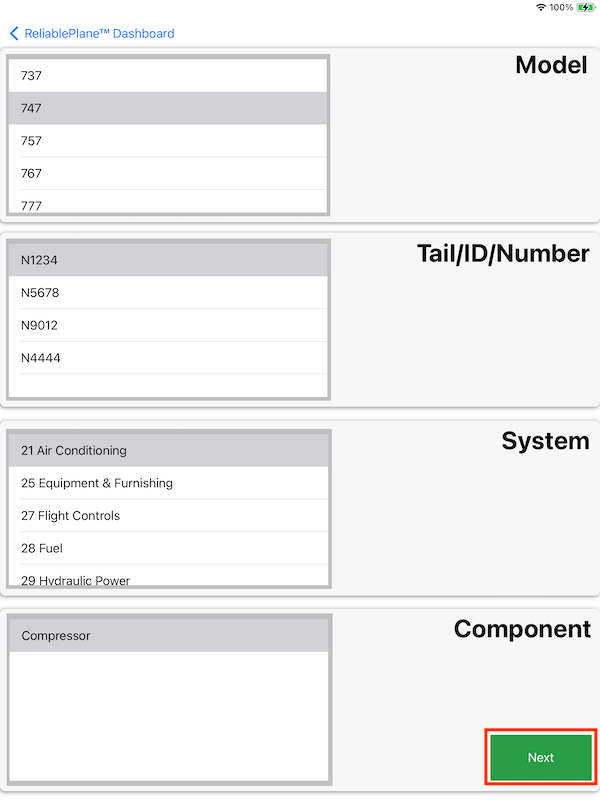
- Select the Aircraft Model / Aircraft Tail-ID / Aircraft System / Aircraft Sub-System /Aircraft Component from the tables and press the NEXT button. The tables will show only CAC Test filtered Systems and Sub-Systems.
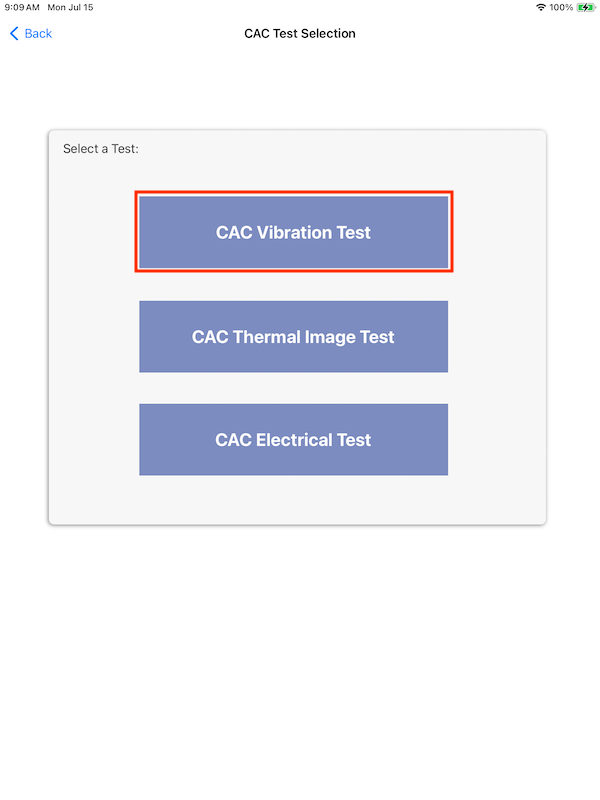
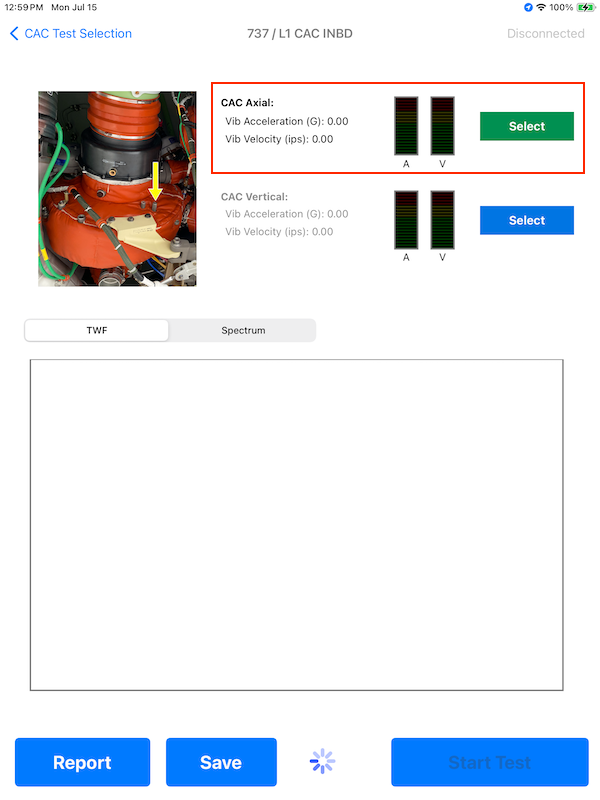
- On the Test Menu screen press the CAC Vibration Test button.
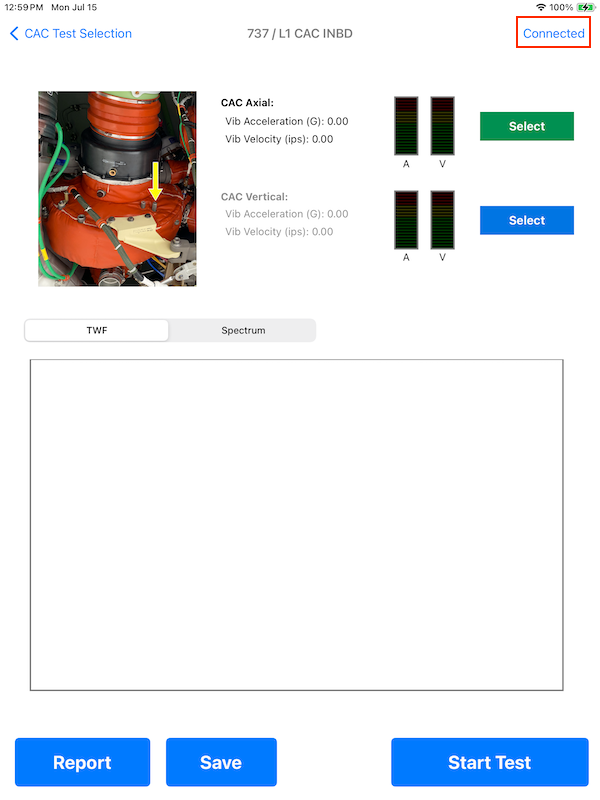
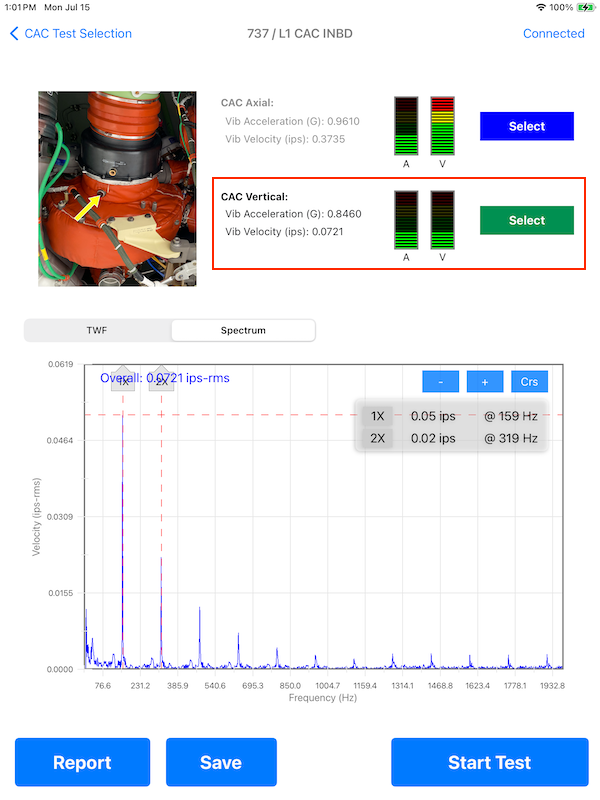
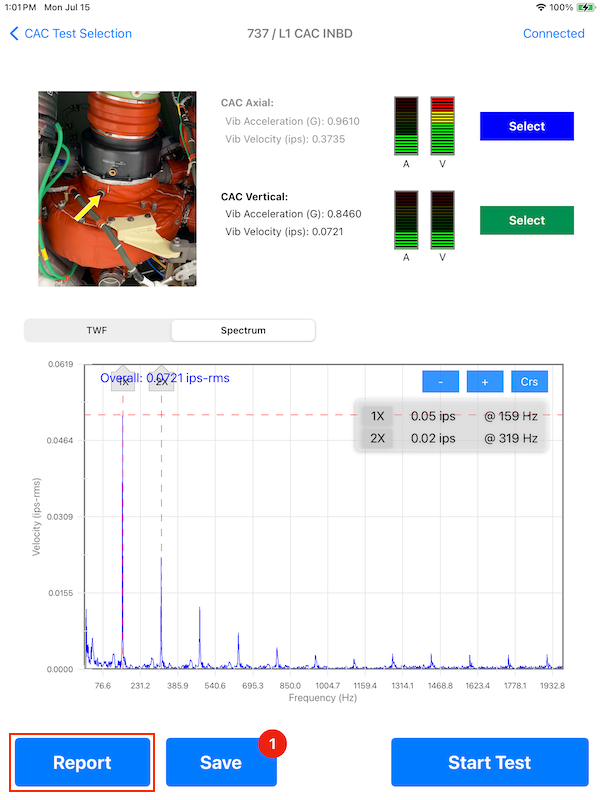
- Turn On the vibration sensor by swiping a magnet to the top of the sensor and place the sensor in the Axial position of the CAC as shown in the picture (yellow arrow), the Select button will be green (the user can start measuring from any other position by pressing the Select button). The sensor will connect to the app and the "Start Test" button will be now Enabled.
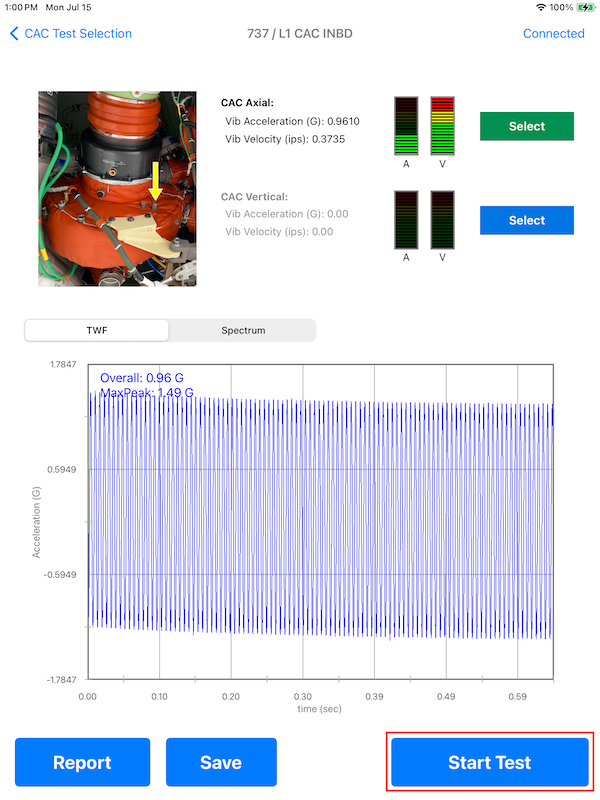
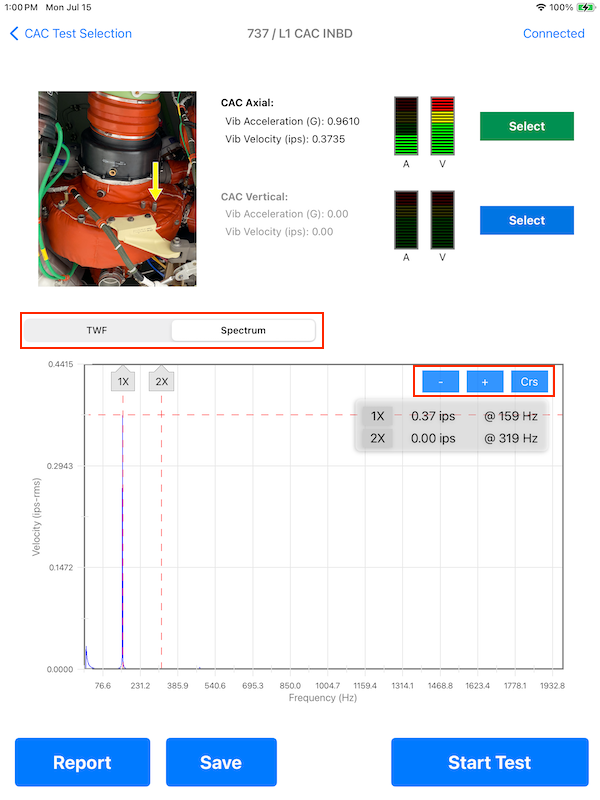
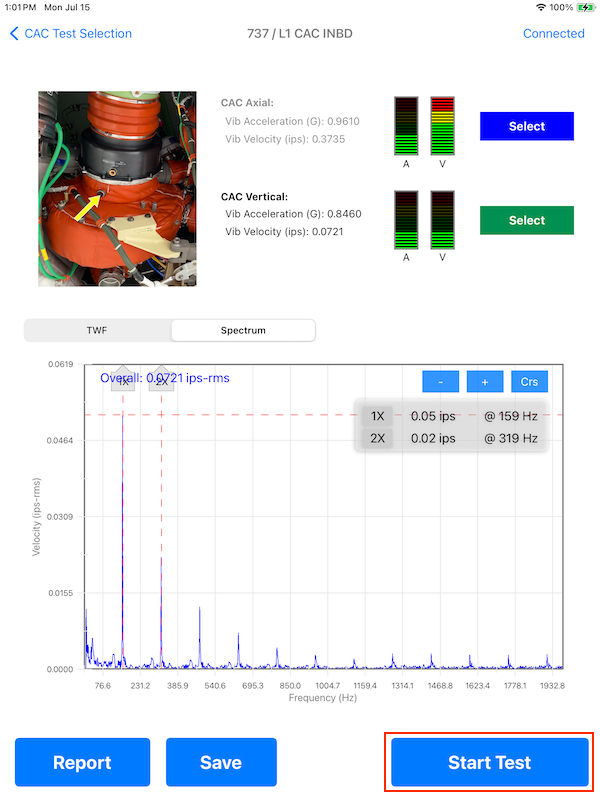
- Once the CAC is running, press the "Start Test" button to collect the vibration data. The vibration acceleration and velocity overalls will appear as numbers and displayed on the level meters, the time-waveform will appear in the plot, now the user can toggle to see the Vibration spectrum. The plot can be zoom-in or out by pinching on the plot, also cursors can added by pressing the "CRS" button. The cursors can be dragged to any other position.
- Repeat the same process for the Radial direction by pressing the "Select" button and then pressing the "Start Button" to collect the vibration data.
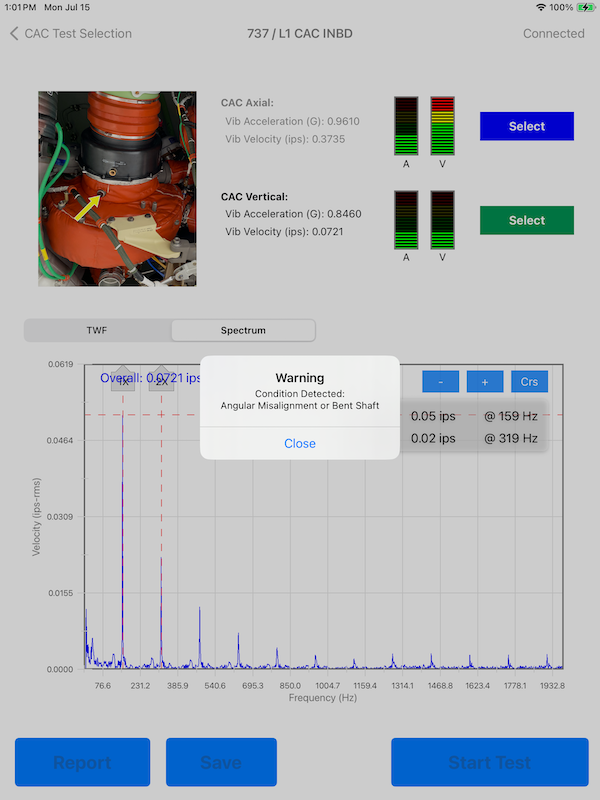
- If the system detects a fault, a dialog box will pop explaining the issue. The user can retake any measurement by pressing the "Select" button of the location and pressing the "Start Test" button again to replace the reading.
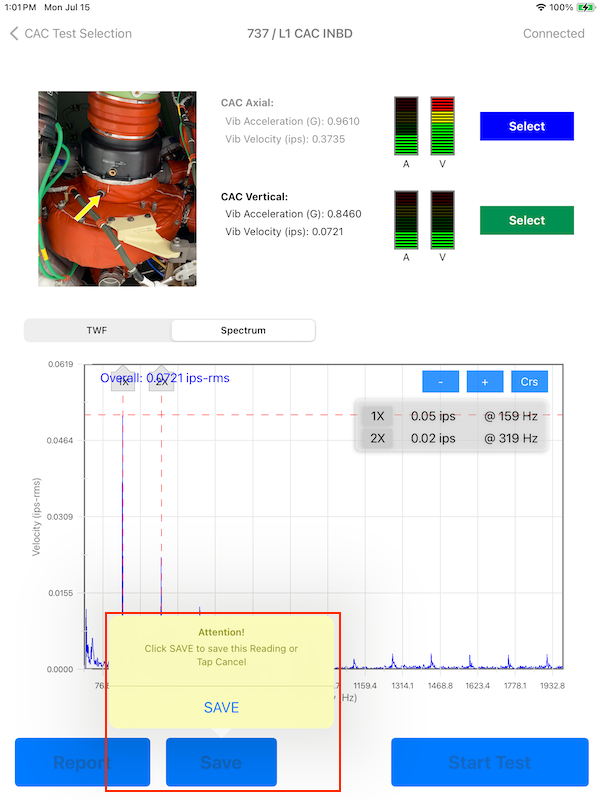
- Once the test is done, press the "Save" button to store the data. A new pop-up will appear allowing to SAVE or CANCEL the reading. Once a reading is saved a bubble will appear besides the "Save" button indicating the number of readings taken for this component. The user can take as many readings as needed, once the data is sync'd to the cloud the reading count will be reset. see: User/Accounts to learn how to sync the readings to the cloud.
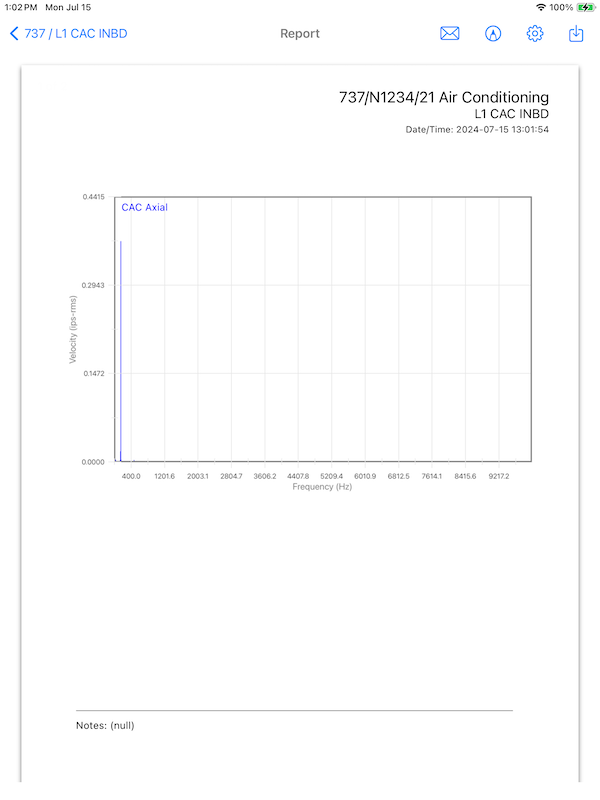
- At this point the user can also generate an instant PDF report, by pressing the "Report" button. This will open a new view with the PDF report. for more info see the Report section
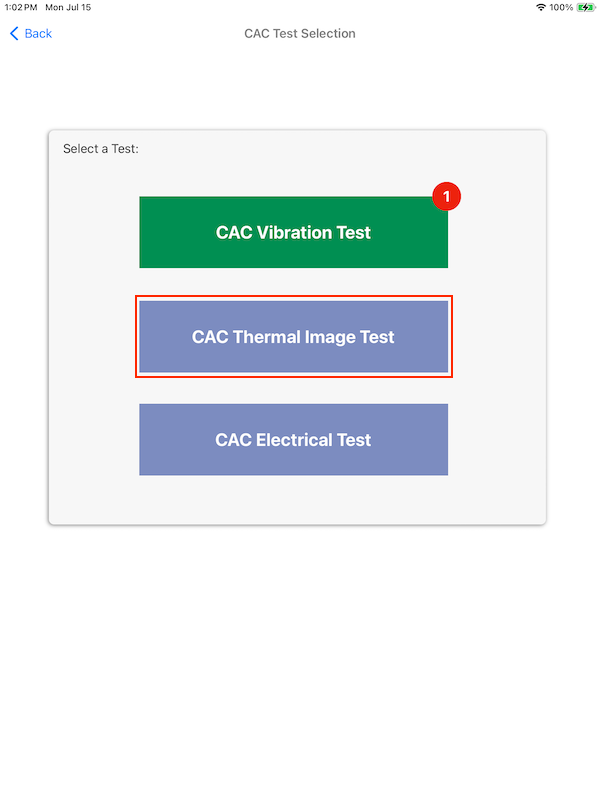
- Press the "Back" button on the top to return to the previous menu. Now select the "Thermal Image Test" to perform the Infrared Imaging test to the CAC. Note: the CAC Vibation Test button now shows green and the bubble displays the number of readings saved.
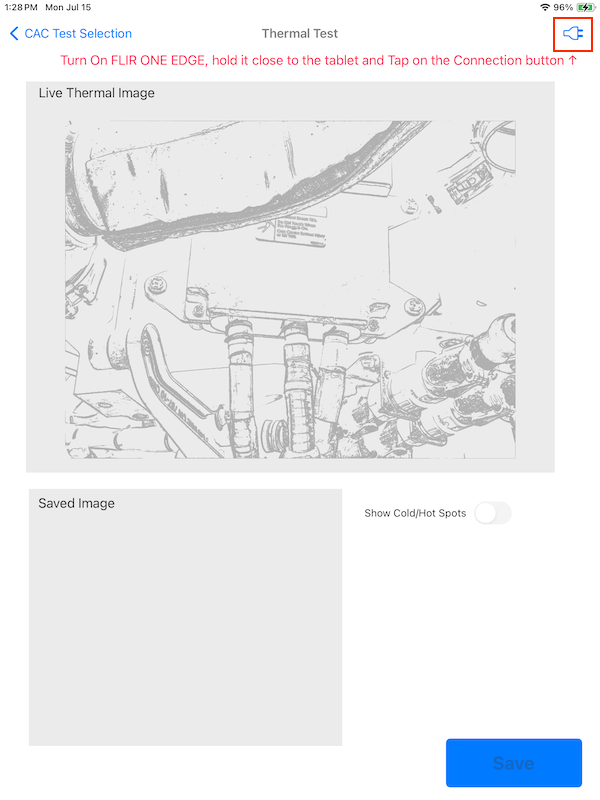
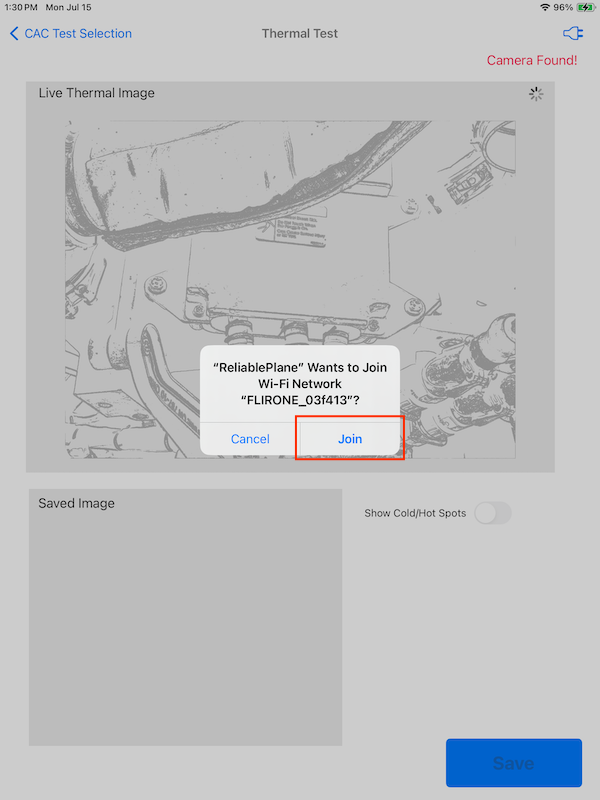
- The thermal image test will display a ghost reference image of the CAC frame to be analyzed. Tuen on the FLIR camera and press the "Connection" button.
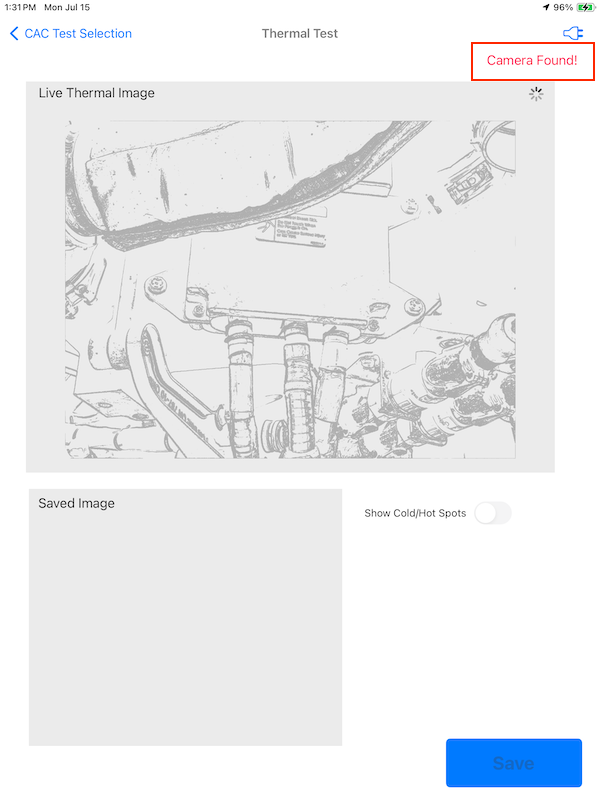
- Wait until the app scans the camera. A pop-up message will ask to join the Camera Network, press "Join". Wait a few seconds and the message "Camera Found" will appear.
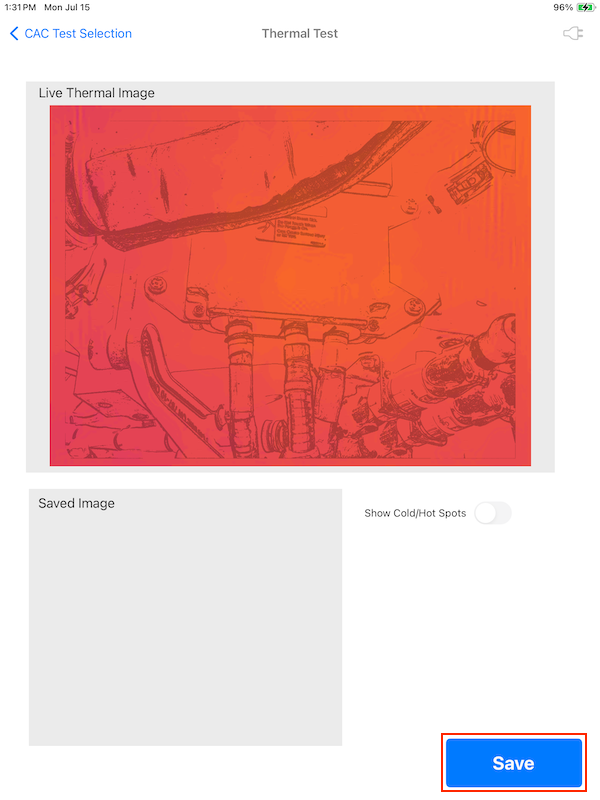
- The IR image will starts streaming and hover over the ghost image. point to the CAC, match the frame portion and press the "Save" button.
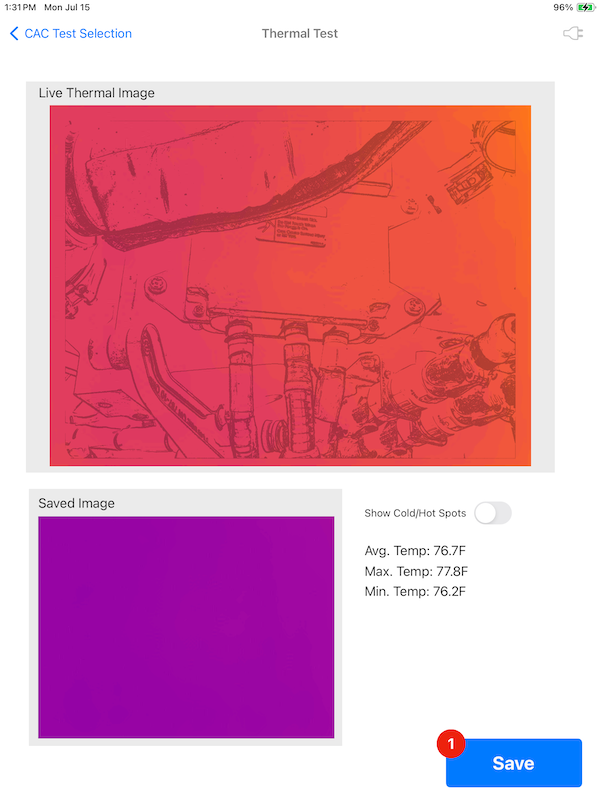
- The saved image will display in the bottom view. The user can take as many pictures as needed and saved them by pressing the "Save" button.
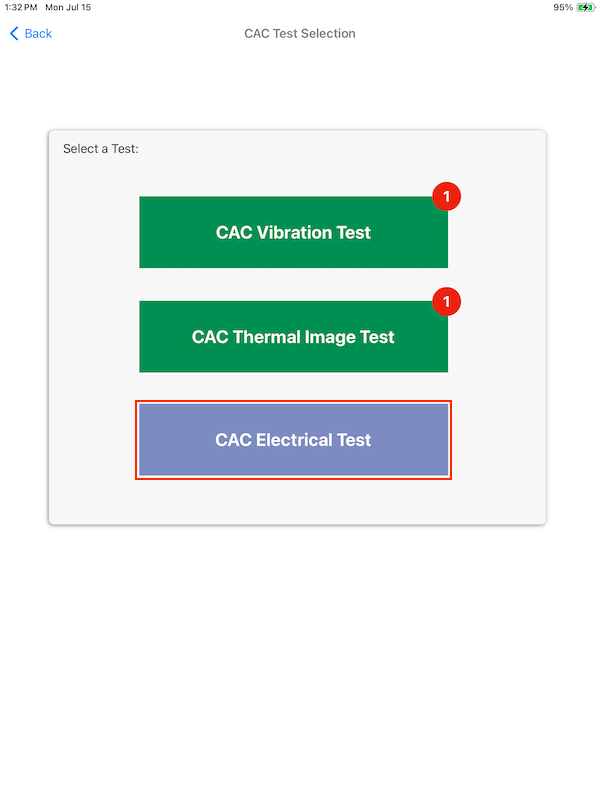
- Press the "Back" button on the top to return to the previous menu. Now select the "CAC Electrical Test" to perform the current test to the CAC.
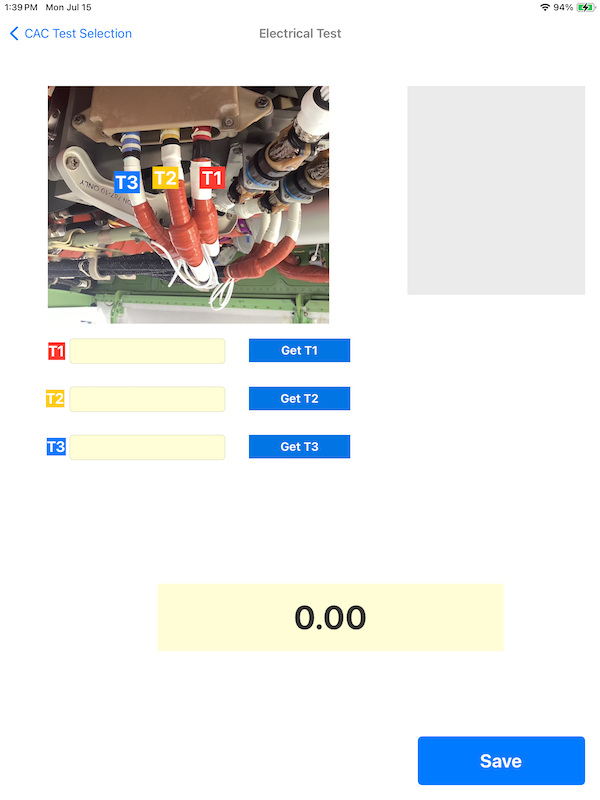
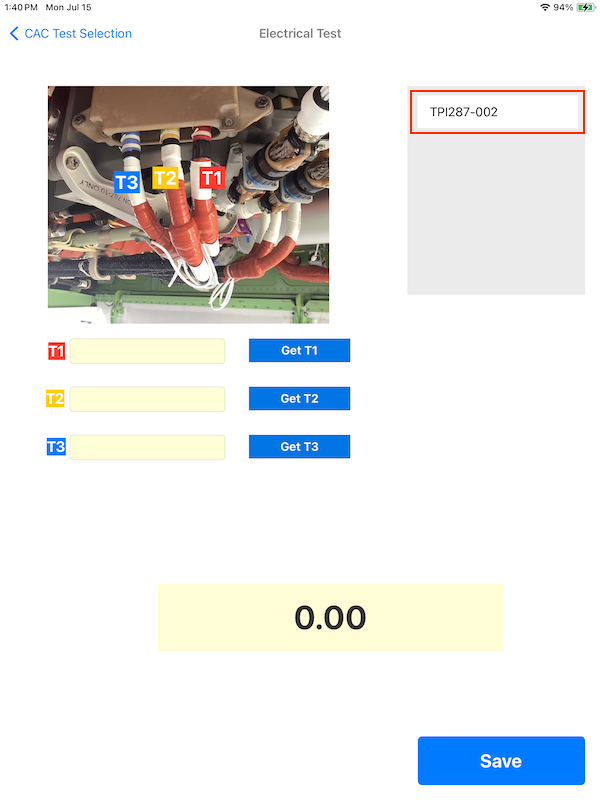
- Turn On the TPI-287 Clamp Meter and select the Current option from the Dial (A) then press the Bluetooth button to tun it on. In the app the device will show on the list. Press on the device to connect.
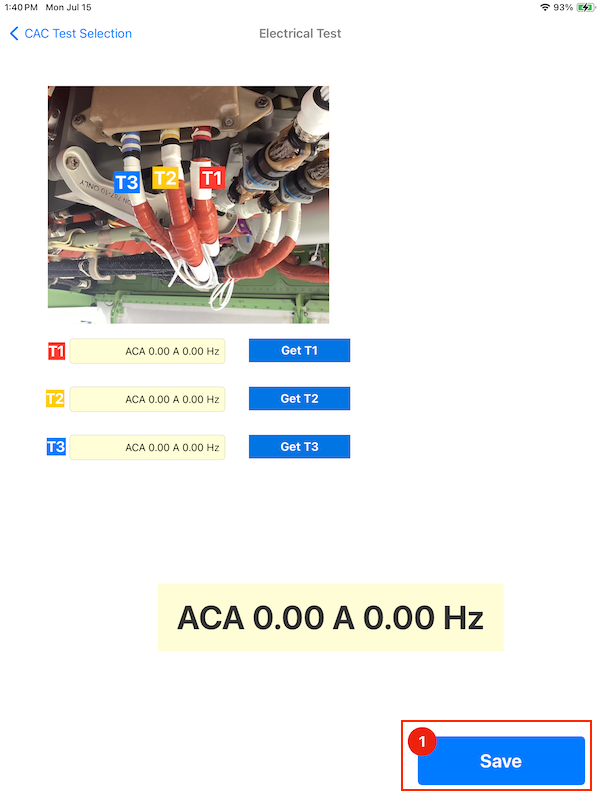
- Place the current clamp on the position T1 of the CAC and press the "Get T1" button. Repeat with points T2 and T3.
- Press the "Save" button store the collected data.
- Once the test is done, press the "bacK" button to return to the previous menu.


Note: Press back to return to the previous page and select another component to test, or return to the main menu. The collected vibration data can be sync to the Cloud, see: User/Accounts
Cloud Management
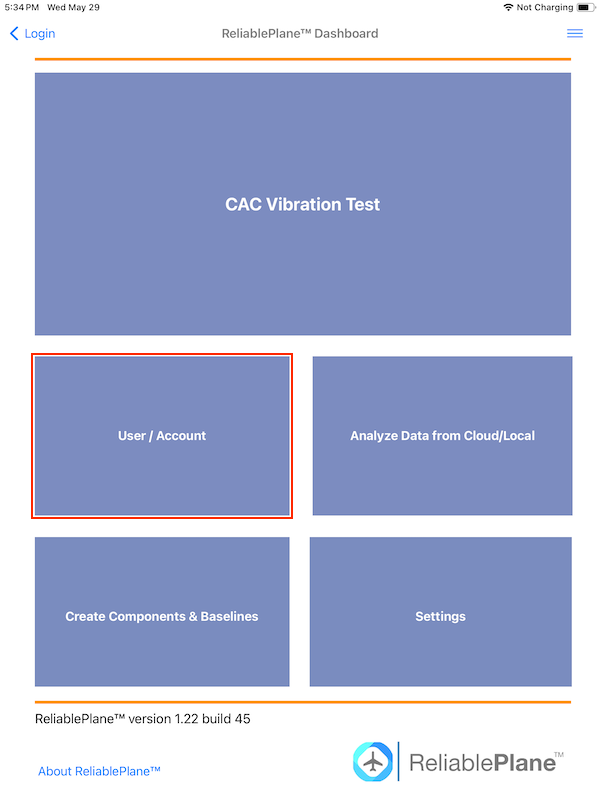
- In the Main Dashboard select Users / Accounts
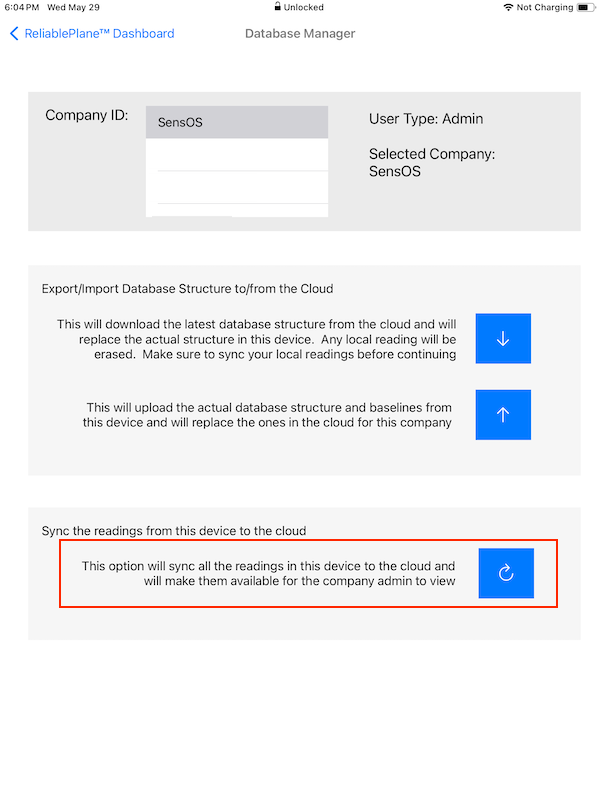
- The List of available Companies will appear on the Table. Press one company (row) from the list to download or upload data to it. The Role of the user will also appear on this section.
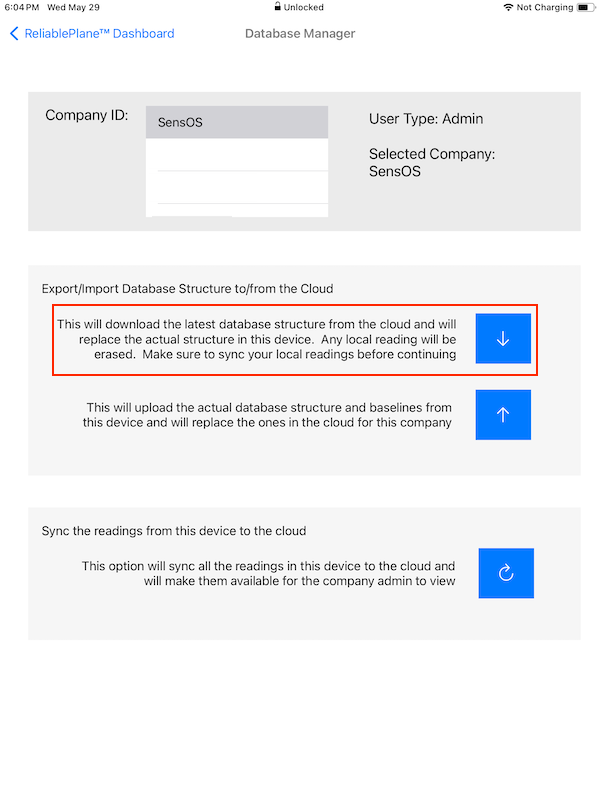
- To Download a Database/Baselines to the device, press the ⬇️ button and then press on the OK button, to Cancel press in any place outside the yellow pop-up. This will start downloading the whole database structure, baselines and instructions/pictures into the device. The process can take a few minutes depending on the size of the database, but this process will continue on the background, if the user decides to leave this page.
- To Upload the actual Database/Baselines in the device to the Cloud, press the ⬆️ button and then press on the OK button, to Cancel press in any place outside the yellow pop-up. This will start uploading the whole database structure, baselines and instructions/pictures to the Cloud The preocess can take a few minutes depending on the size of the database, but this process will continue on the background, if the user decides to leave this page.
- To Sync collected data from the tests, press the 🔄 button and then press on the OK button, to Cancel press in any place outside the yellow pop-up. This will start the sync of all the collected data to the Cloud. If the user leaves the page the process will continue in the background. The collected data can be now viewed in the WebApp on any browser (https://app.reliableplane.com)
Note: The device will need Internet connectivity for this features.
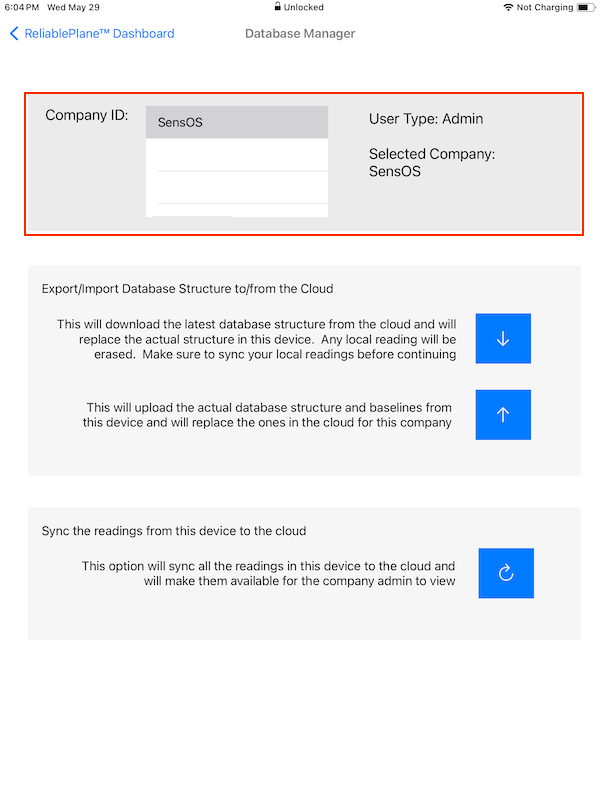
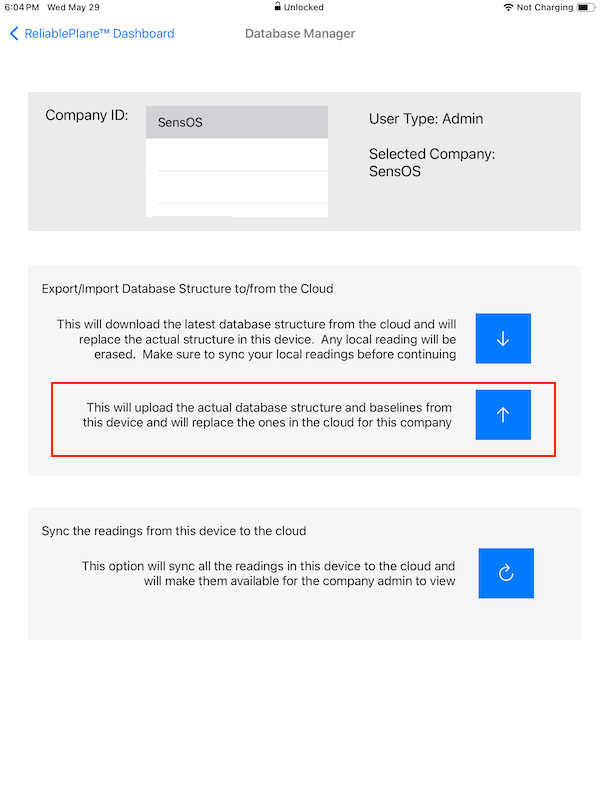
Note: The Upload button will be enabled only for the Admin user role.
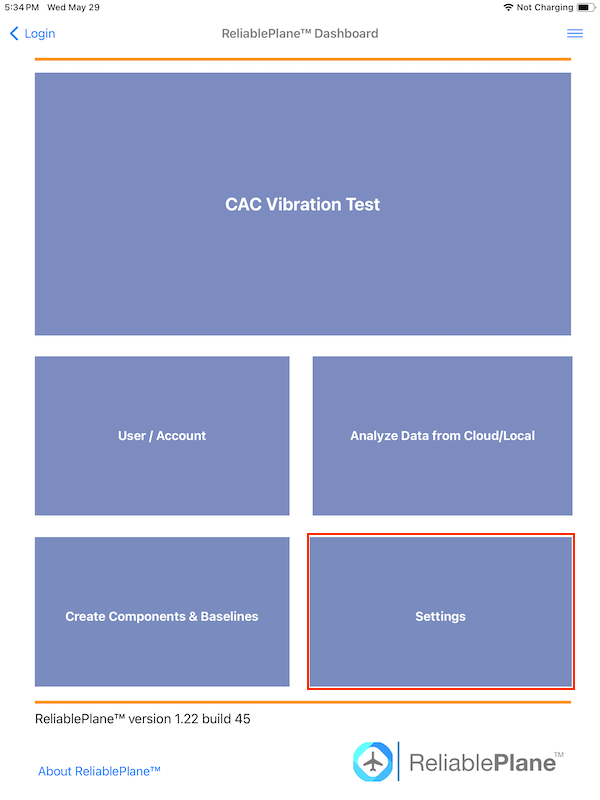
Settings
- In the Main Dashboard press the Settings button.
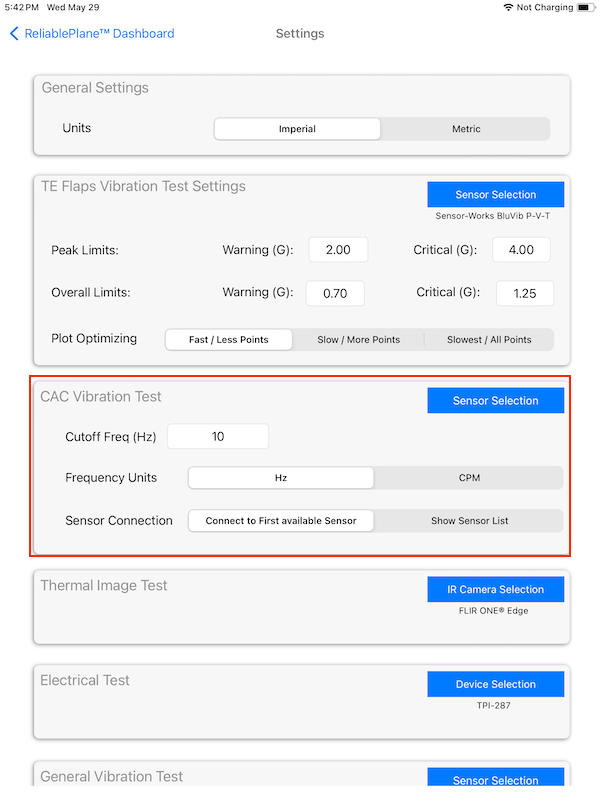
- The CAC Vibration Test Settings will allow the user select how to connect to the vibration sensor. The "Connect to First Available Sensor' will automatically connect to the sensor once turned on, the "Show sensor list" will display in the CAC vibration test view the list of sensors that are in the range, so the user can select to which to connect. Here the user can also change the frequency units from Hz to CPM, and add a Cutoff Frequency filter value.
- In the Settings view, the user can also change the default vibration thresholds and select the ploting resolution. (Selecting a plot will more points will make the ploting time increase in the baseline and test vibration waveforms.
Note: This option will be Enabled only for users with Admin Role.
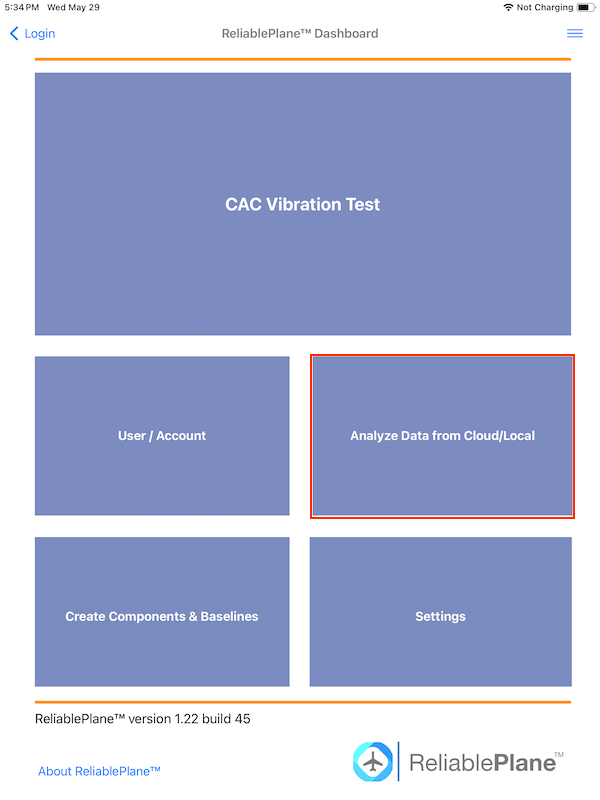
View Data from Cloud/Local
- To view data stored in the iPad or the data already uploded to the cloud (by any user in the same company) press the Analyze Data from Cloud/Local button in the Main Dashboard.
- Select the Aircraft Model / Tail / System / Component and the press Next
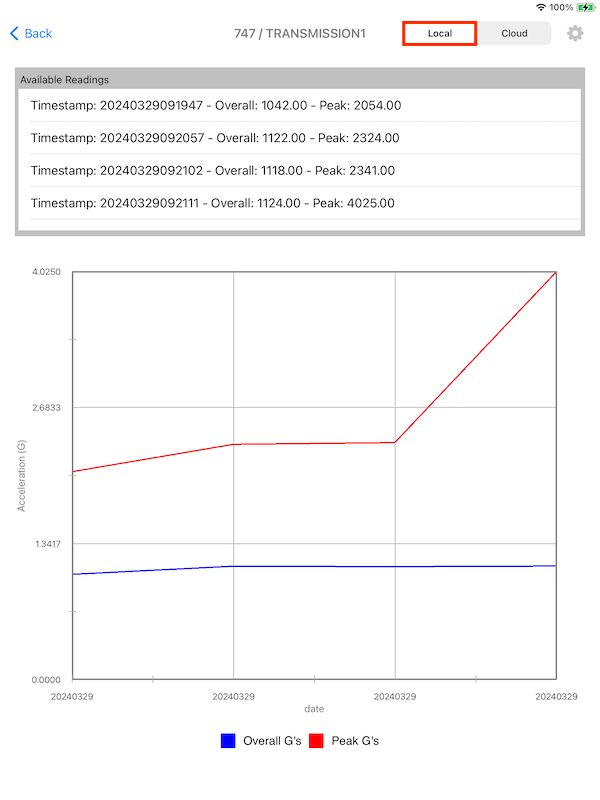
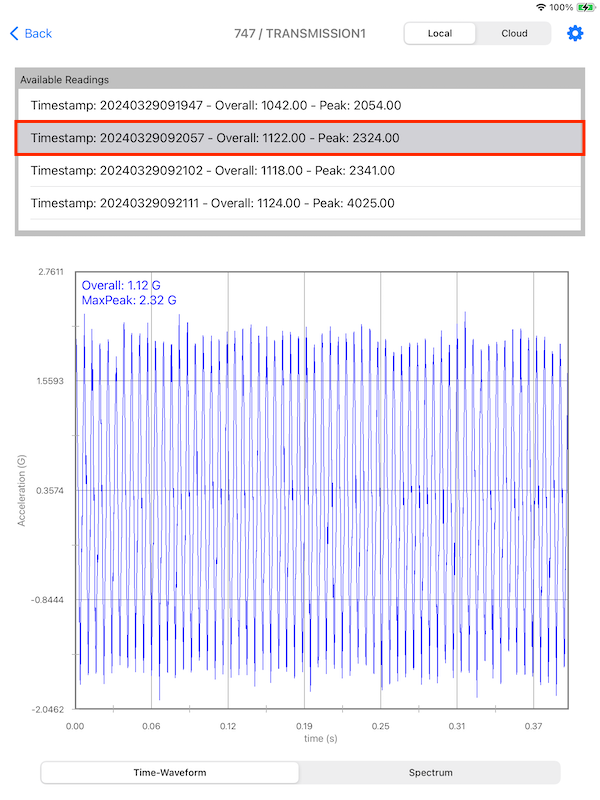
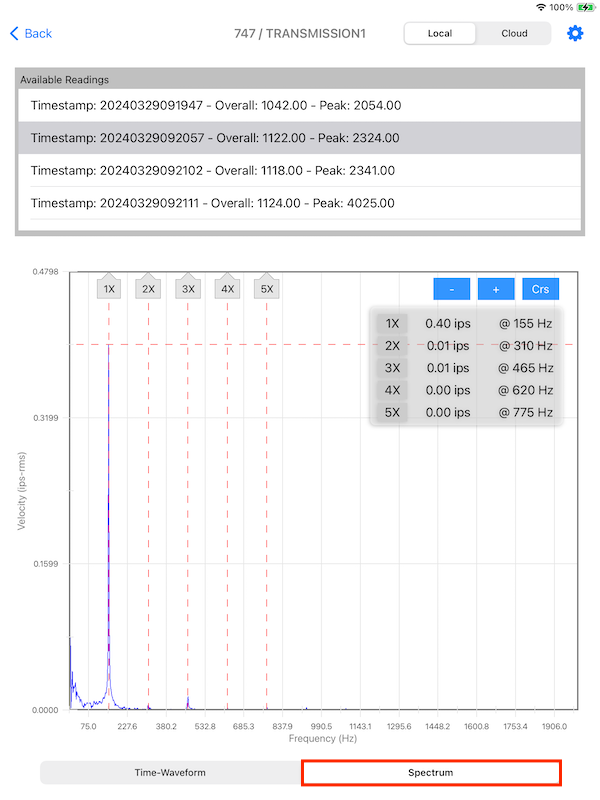
- If the data source selector is set to Local, the list of not yet uploaded readings will be displayed (timestamps). On the bottom the overall and peak values trends of those readings will be displayed. Press on any reading from the list to display the vibration time-waveform plot.
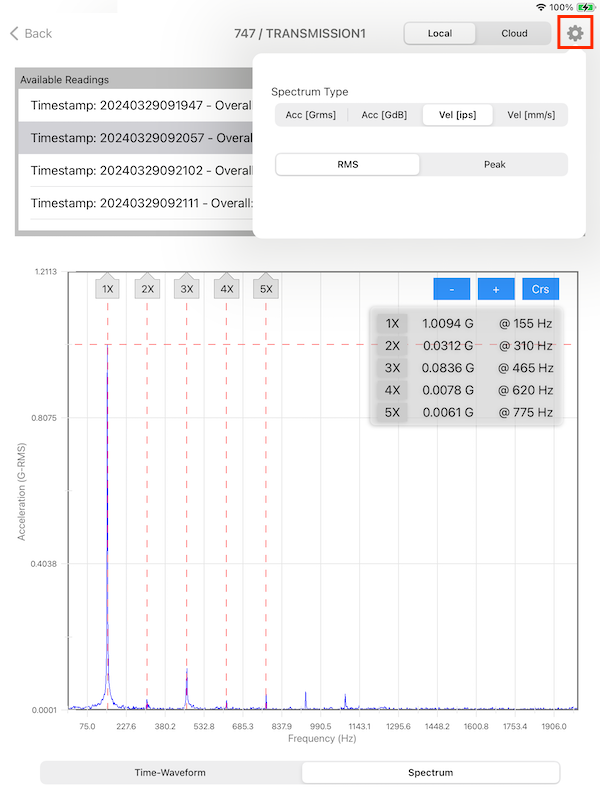
- To see the Spectrum plot of the selected reading, press the Spectrum button on the bottom of the screen. To display the cursors, press the "Crs" button; add or remove cursors with the "+" or "-" buttons. To switch between Acceleration/Velocity spectrum press the Configuration button on the top bar.
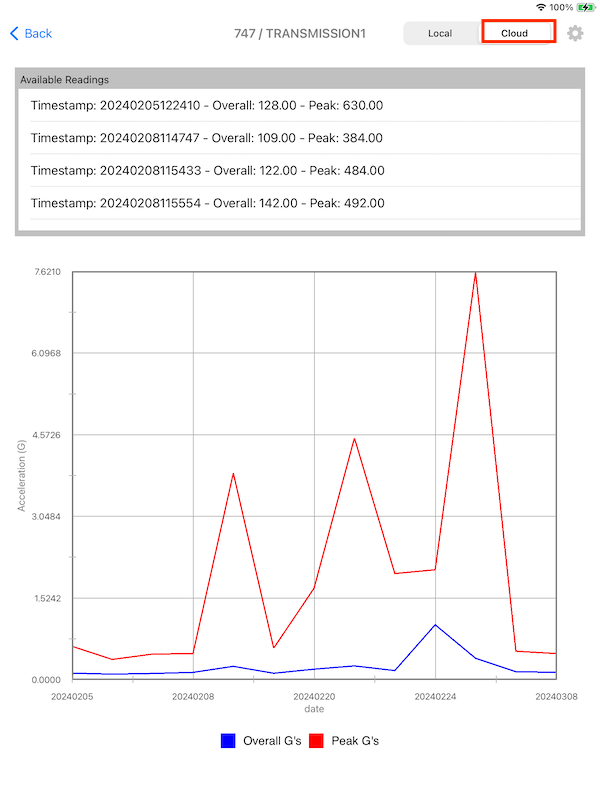
- To view the data already uploaded to the cloud, select the Cloud option. The list of all uploaded reading will be displayed (timestamps). On the bottom the overall and peak trends of those readings will be displayed. Press on any reading from the list to display the vibration time-waveform plot. Press the Spectrum to switch to the Spectrum Plot.1
Note: The device will need Internet connectivity for the cloud feature. Local readings will be available without internet connection.

Report
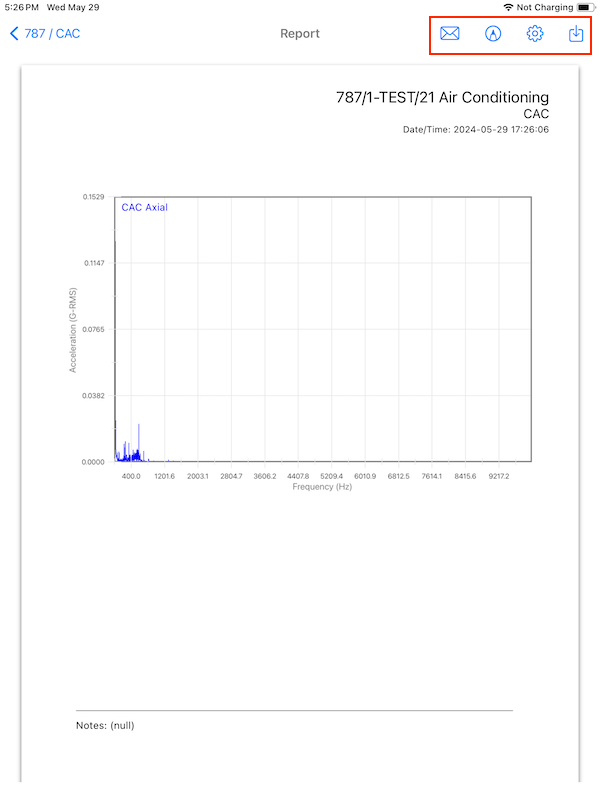
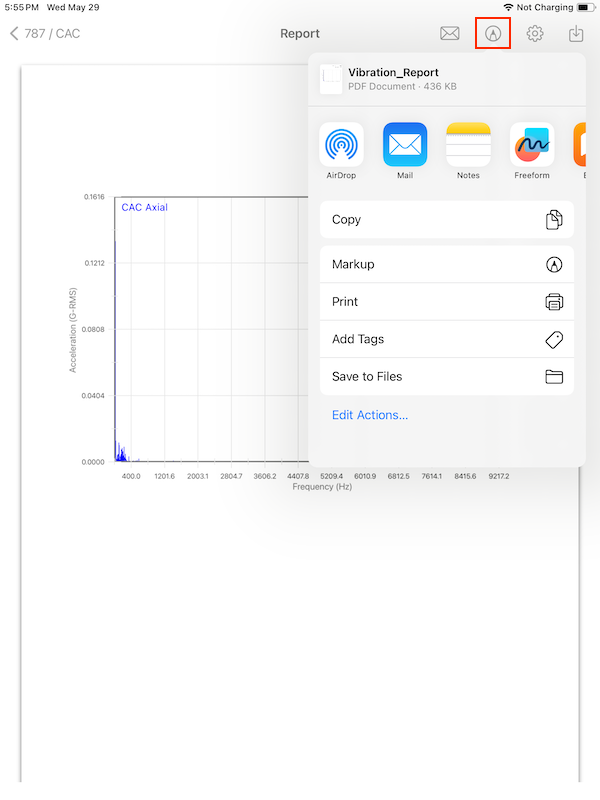
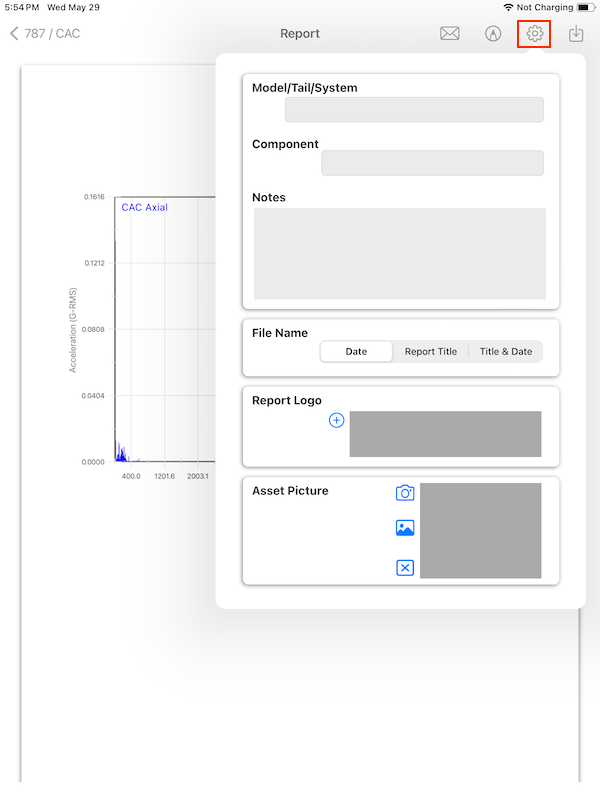
- The report section has several options on the top bar menu: a)send by email, b)markup, c)configuration, d)Save Local.
- Pressing the Email button will generate an email with the report as an attachment. The user can modify the subject and/or add text to it.
- Pressing the Markup tool button will open a popup allowing the user to draw on the pdf and share it using different options available in the iPadOS.
- The Configuration button will open a popup allowing the user to change the name of the report, add the company logo, add a picture, add notes and change the name of how the pdf file is saved. By default the file will be saved as a timestamp, but the user can select to add the aircraft information with or without the timestamp.
- The Save button will save the report locally in the iPad and the user can access it later using the Report Manager. See: Report Manager section. After the report is saved a popup will appear with the message "Report Saved".
Note: If a fault condition was detected during the test, it will show in the notes at the bottom of the page.
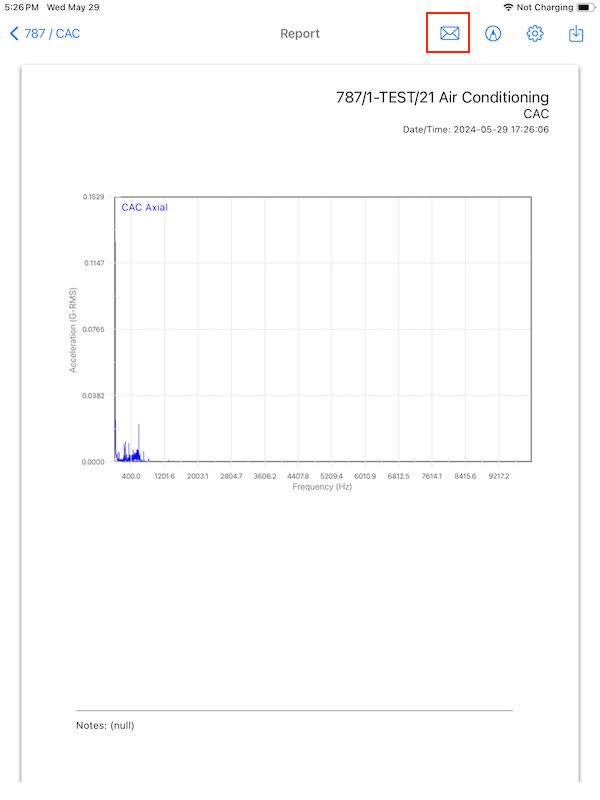
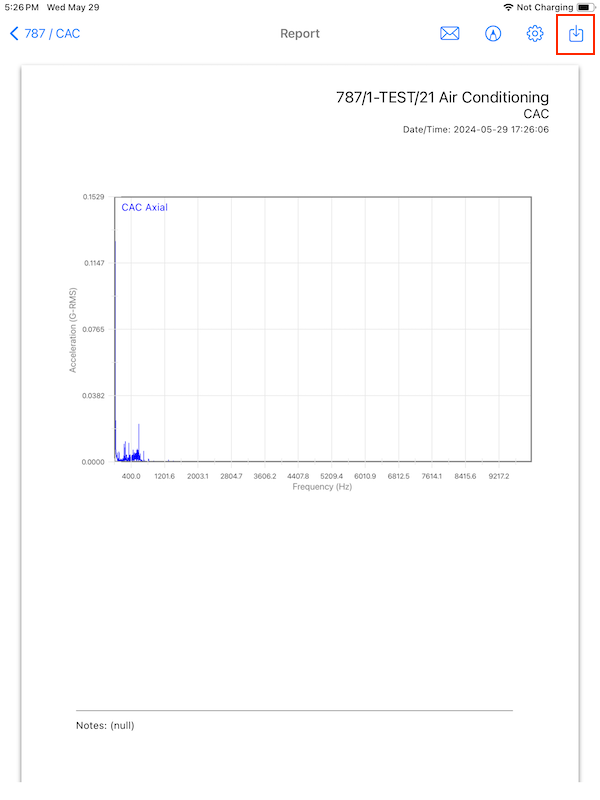
Note: By default the title of the report will show the Aircraft information in the form of a path: Aircraft Model / Tail / System / Component.
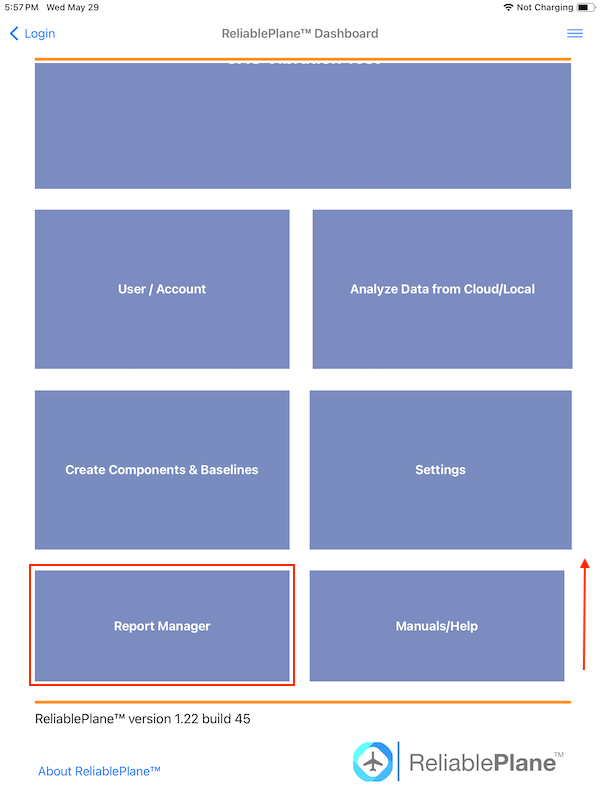
Report Manager
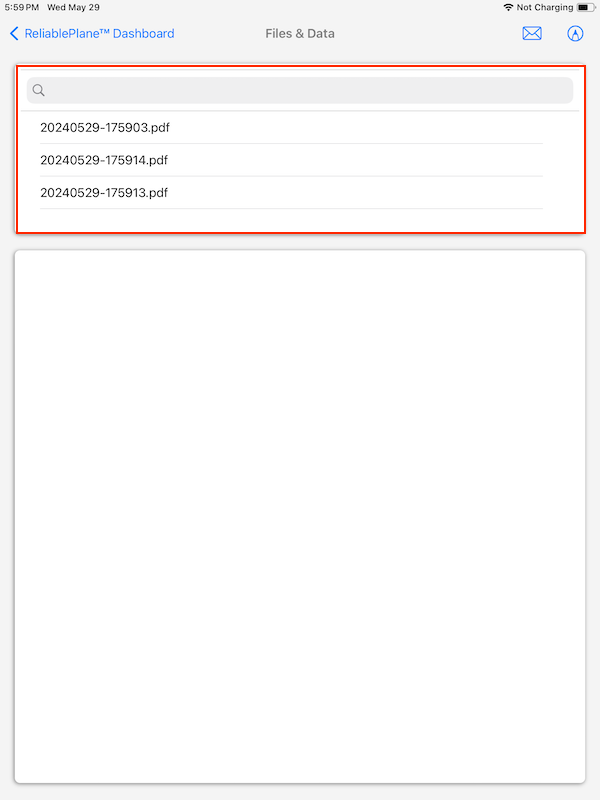
- In the Main Dashboard scroll up and press the Report button.
- A list of all saved reports will appear on top of the page. The user can also use the search bar to filer the list.
- Press on a Report and the pdf will display on the screen. The user can email or markup the selected report using the buttons on the top menu bar, this buttons have the same functionality explained in the Report section, see: Report

Changelog
Version 2.02 b.53 (14 Jul, 2024)
- Added Sub-System Level to Hierarchy
Version 1.22 b.45 (18 May, 2024)
Initial Release